Difference between revisions of "Resistance meter"
(Created page with " // Open whatever port is the one you're using. myPort = new Serial(this, Serial.list()[0], 9600); myPort.bufferUntil('\n'); // Trigger a SerialEvent on new line //On the s...") |
|||
| (5 intermediate revisions by one other user not shown) | |||
| Line 1: | Line 1: | ||
| + | {| style="width: 800px;" | ||
| + | |- | ||
| + | | | ||
| + | ==Objective== | ||
| + | |||
| + | The course will show you how to use Processing software to display the value of the resistance meter in the form of the graph, and the resistance meter can be achieved by Microduino. | ||
| + | |||
| + | ==Equipment== | ||
| + | *'''[[Microduino-Core]]''' | ||
| + | *'''[[Microduino-FT232R]]''' | ||
| + | |||
| + | *Other Hardware Equipment | ||
| + | **A USB cable | ||
| + | **A 20k Ω resistor | ||
| + | **A 104 ceramic capacitor | ||
| + | **A bread board | ||
| + | **A box of jumpers | ||
| + | |||
| + | |||
| + | |||
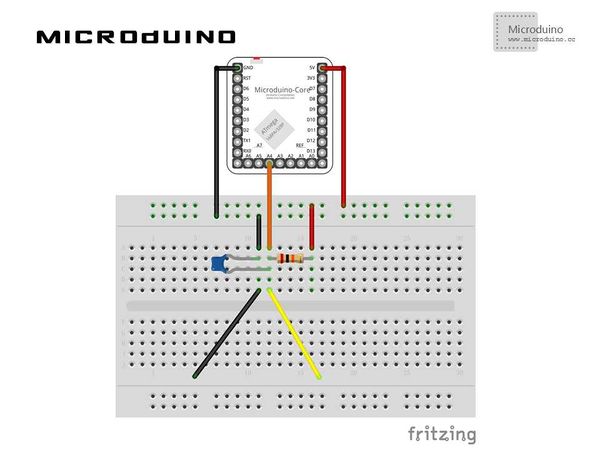
| + | ==Schematic Diagram== | ||
| + | |||
| + | |||
| + | [[File:ResistanceMeterSchematics.jpg|600px|center|thumb]] | ||
| + | |||
| + | |||
| + | ==Program== | ||
| + | |||
| + | Referring to ResistanceMeter | ||
| + | |||
| + | processingResistanceMeter | ||
| + | |||
| + | ==Debugging== | ||
| + | |||
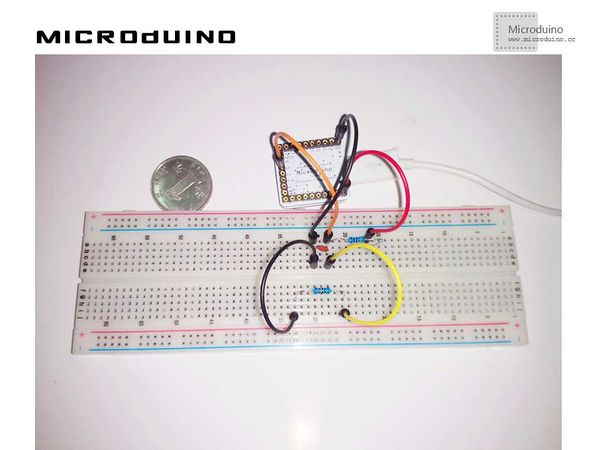
| + | Step 1:Building hardware environment according to the schematic diagram, just as follows: | ||
| + | [[File:IResistanceMeterConnectionDiagram.jpg|600px|center|thumb]] | ||
| + | |||
| + | |||
| + | Step 2: Here is the code we need: | ||
| + | |||
| + | The code of two ends (Processing and Microduino) | ||
| + | |||
| + | Microduino: | ||
| + | |||
| + | //Using filter algorithm to calculate resistance and displaying the data on Processing via serial output. | ||
| + | |||
| + | //filter Algorithm | ||
| + | float filter() | ||
| + | { | ||
| + | float sum = 0; | ||
| + | for(int count = 0; count < N; count++) | ||
| + | { | ||
| + | sum += r; | ||
| + | delay(5); | ||
| + | } | ||
| + | return (float)(sum / N); | ||
| + | } | ||
| + | |||
| + | Processing: | ||
| + | |||
| + | //After getting the data of the first serial port, you can define or cache the data if there is a new line. | ||
| + | |||
| + | // is always my Microduino, so I open Serial.list()[0]. | ||
// Open whatever port is the one you're using. | // Open whatever port is the one you're using. | ||
myPort = new Serial(this, Serial.list()[0], 9600); | myPort = new Serial(this, Serial.list()[0], 9600); | ||
myPort.bufferUntil('\n'); // Trigger a SerialEvent on new line | myPort.bufferUntil('\n'); // Trigger a SerialEvent on new line | ||
| − | //On the | + | //On the screen, displaying the data received from Microduino in the form of graph and marking scale. |
String val = myPort.readStringUntil('\n'); | String val = myPort.readStringUntil('\n'); | ||
| Line 34: | Line 97: | ||
text ( resistance+unit, 0, 10); | text ( resistance+unit, 0, 10); | ||
| − | Step | + | Step 3: Download the code and get it compiled successfully. |
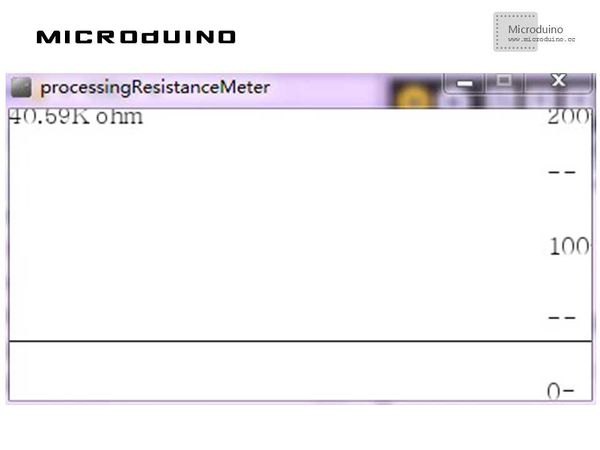
| − | Step | + | Step 4: Putting the resistor ready to measure between the yellow and the black lines on the graph, watching resistance on Processing. |
==Result== | ==Result== | ||
Latest revision as of 09:18, 13 September 2016
ObjectiveThe course will show you how to use Processing software to display the value of the resistance meter in the form of the graph, and the resistance meter can be achieved by Microduino. Equipment
Schematic Diagram
ProgramReferring to ResistanceMeter processingResistanceMeter DebuggingStep 1:Building hardware environment according to the schematic diagram, just as follows:
The code of two ends (Processing and Microduino) Microduino: //Using filter algorithm to calculate resistance and displaying the data on Processing via serial output. //filter Algorithm
float filter()
{
float sum = 0;
for(int count = 0; count < N; count++)
{
sum += r;
delay(5);
}
return (float)(sum / N);
}
Processing: //After getting the data of the first serial port, you can define or cache the data if there is a new line. // is always my Microduino, so I open Serial.list()[0].
// Open whatever port is the one you're using.
myPort = new Serial(this, Serial.list()[0], 9600);
myPort.bufferUntil('\n'); // Trigger a SerialEvent on new line
//On the screen, displaying the data received from Microduino in the form of graph and marking scale. String val = myPort.readStringUntil('\n');
if (val != null) {
if ("Infinity!!".equals(val)) {
unit="resistancetoo big";
}
else {
if ("K ohm".equals(val)) {
unit="K ohm";
}
else if (" ohm".equals(val)) {
unit=" ohm";
}
else {
val = trim(val);
println(val);
resistance=Float.parseFloat(val);
}
}
}
vals[vals.length-1] = 200-resistance;
//Display scale
text ( "200-", 370, 10);
text ( "--", 370, 50);
text ( "100-", 370, 100);
text ( "--", 370, 150);
text ( "0-", 370, 200);
//show current num
text ( resistance+unit, 0, 10);
Step 3: Download the code and get it compiled successfully. Step 4: Putting the resistor ready to measure between the yellow and the black lines on the graph, watching resistance on Processing. ResultThe graph will display the current resistance.
Video |


