Difference between revisions of "Open Source WiFi Weather Station"
(Created page with "{| style="width: 840px;" |- | ==Overview== *Project: Open Source WIFI Weather Station System *Objective: To get the temperature, humidity, illumination and even PM2.5 data a...") |
(→Bill of Material) |
||
| Line 24: | Line 24: | ||
|[[Microduino-Temp&Hum]] ||1||Digital temperature and humidity sensor | |[[Microduino-Temp&Hum]] ||1||Digital temperature and humidity sensor | ||
|- | |- | ||
| − | |[[Microduino-Air | + | |[[Microduino-Air Quality]] ||1||Air quality sensor |
|- | |- | ||
|[[Microduino-Light]] ||1||Light-sensitive sensor | |[[Microduino-Light]] ||1||Light-sensitive sensor | ||
Revision as of 08:31, 10 March 2016
ContentsOverview
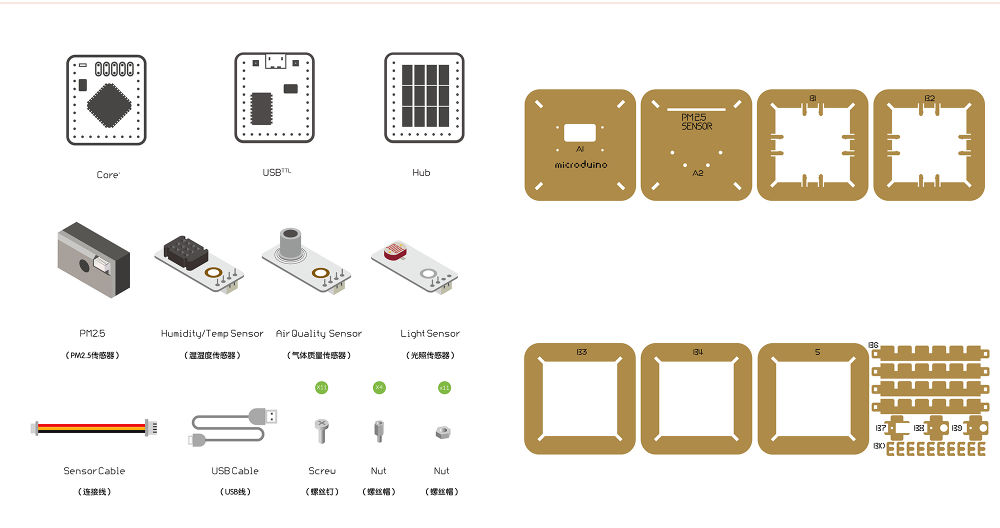
This device can acquire real-time temperature, humidity, illumination and even PM2.5 data around you, and display them on the screen. You can also connect it to the internet if needed. With a phone or a laptop, you can check the data anytime and anywhere, which can be easily achieved by Microduino. Bill of Material
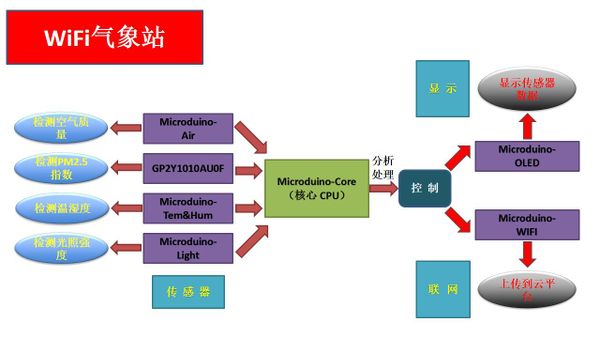
Principle of ExperimentOn the special plate of the Weather Station is installed with sensors with multi-parameters, including the digital temperature and humidity sensor (Microduino-Tem&Hum), the light sensor (Microduino-Light), the air quality sensor of Microduino-Air and the PM2.5 sensor (gp2y1010au0f). Each sensor is connected with Microduino-Sensorhub, whose data can be analyzed and processed by the Microduino core module, and then displayed on the OLED. At the same time, you can connect the Microduino-Wifi and Microduino-Core together to the internet, communicating with mCotton (IOT platform) and giving feedback to users via text and graph info. You can check this data anytime and anywhere with your phones or laptops. This system is composed of sensors, coordinator, network adapter, OLED display, mCotton, integrated with sensor technology, network communication technology, OLED display technology and IOT technology. Sensors mainly complete the data collection of the temperature, humidity, light intensity, air quality, then the coordinator can process and analyze the collected data. Meatime, you can connect it to the internet and communicate with mCotton through the network adapter, and check these data on the mCotton.
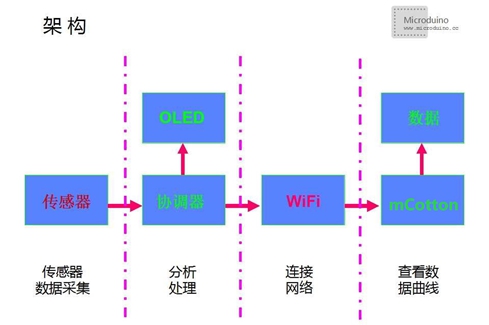
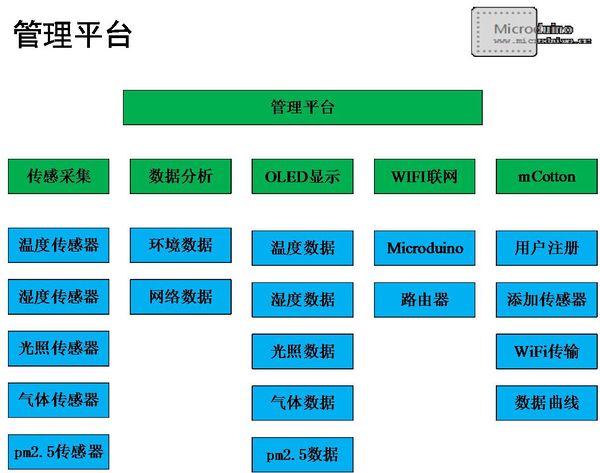
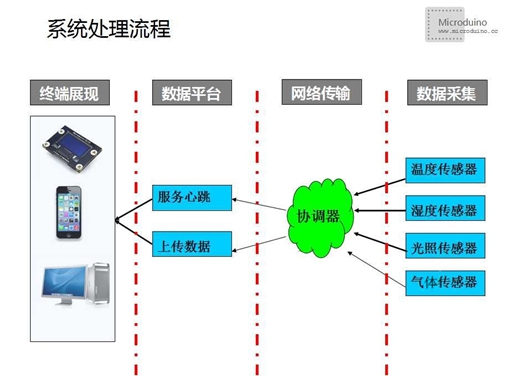
The platform can be divided into two parts: Microduino core control, responsible for sensors' data collection and connecting to the internet; mCotton IOT platform, responsible for displaying data to users in the way of curves so that you can check and share your surrounding weather, as follows:
The picture below display the procedure of the system. Data Collection System: Mainly responsible for collecting ambient temperature, humidity, light intensity data and etc. The data collected from the sensors will be uploaded to the Microduino core. Wireless Transmission System: The system sends the collected data to the server through wireless network, adopting Wifi data transmission. Data Processing System: This system is responsible for storage, upload and visual display so that users can check weather on their PC or phone client. DocumentWeather Station Code:【Weather Station Code】 Local Weather Station Code:【Local Weather Station Code】 Weather Station Code Github:Weather_Station Debugging
Weather Station needs to be connected into the internet, so a server for storage and display is indispensible. First of all, we need to build a network server.
Currently positioned to do an open universal networking platform, mCotton mainly providse sensor data access, storage and display services. It can offer a networking project platform for all of the open source software and hardware enthusiasts and manufacturing enterprises, enabling them to deliver IOT electronic products without the need to care about the server implementation details and operation. We only need to register an account in mCotton, it will provide you with a unique KEY API,which is used to recognize identity in the server. MCotton as an open public Internet access platform, it aims to serve all the enthusiasts and developers, so that the sensor data access, storage and display become easy and simple. Here we introduce how to use the mCotton platform to complete your easy access.
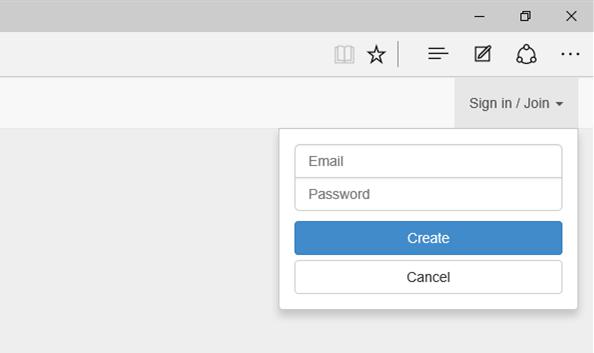
Open the main page of mCotton: somvpn.cn:3000, click " Sign in/Join ", you'll see a pop-up showing login/register, then click "Create account" and enter the user register page. On the user register page, you can fill in the relevant information and complete.
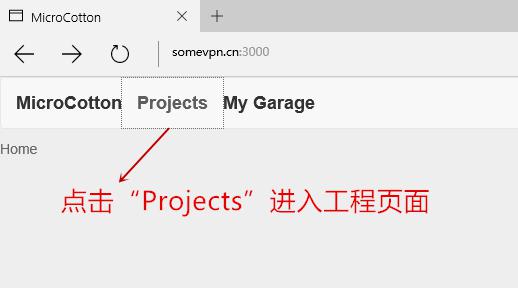
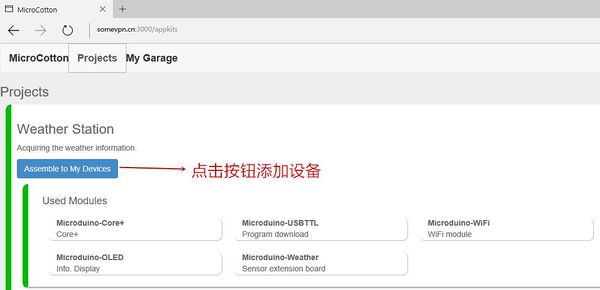
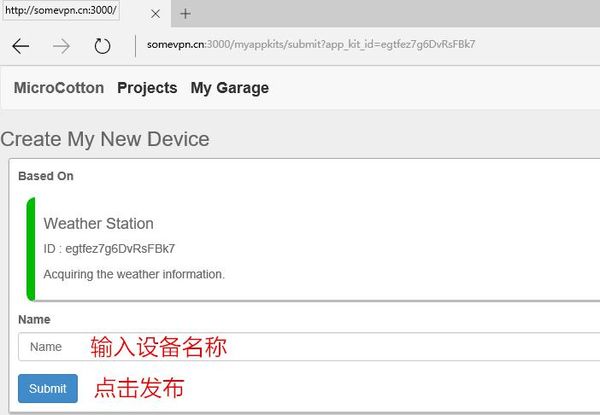
Click "Projects" after login and enter the engineering page. Find "Weather Station" in the engineering page, click " Assemble to My Devices " and you can add your devices. Enter the name your device in "Name" and click "Submit" to publish.
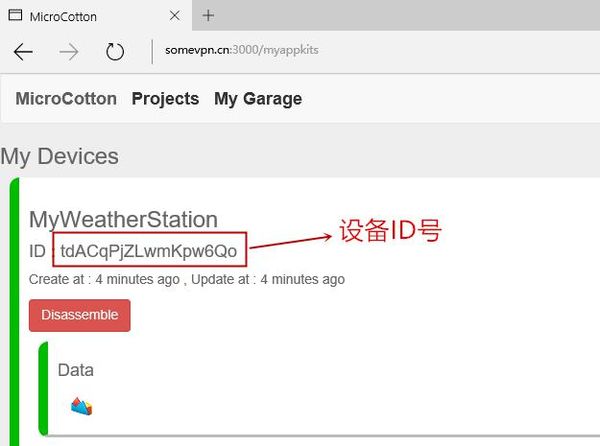
After the publish, you can see your device on " My Garage " page. Find your Weather Station device and remember its unique ID.
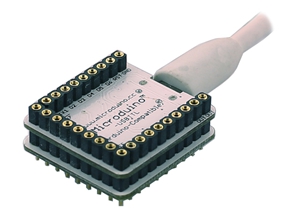
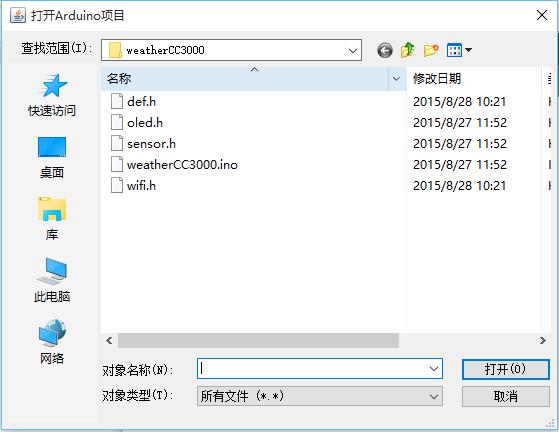
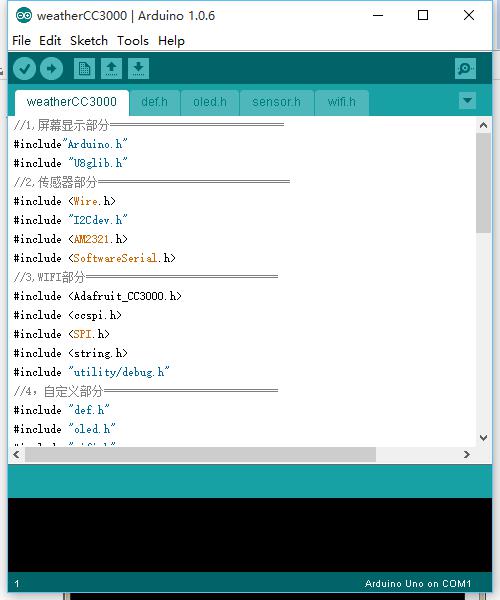
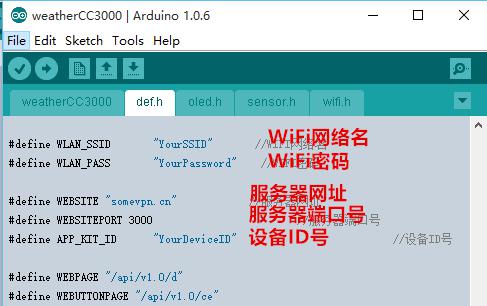
Stack Microduino-Core+ and Microduino-USBTTL without fixed order, and connect them to the PC via USB cable. Make sure you built Microduino IDE, otherwise, please refer to: 1-Arduino IDE installation instructions. Open Arduino IDE programming software, click【File】->【Open】 Scan the project program address, click " weatherCC3000.ino " and open it. Corresponding parameters needed to be configured in the "def.h" file:
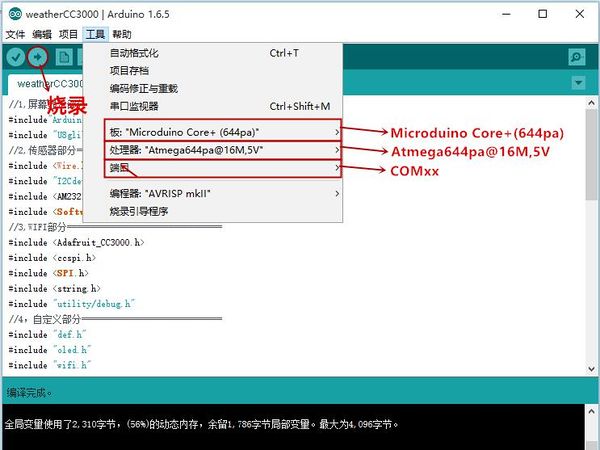
Click "Tool, select Microduino-Core+ as the board card, and the processor " Atmega644pa@16M,5V ", then burn the program. Install the Weather Station
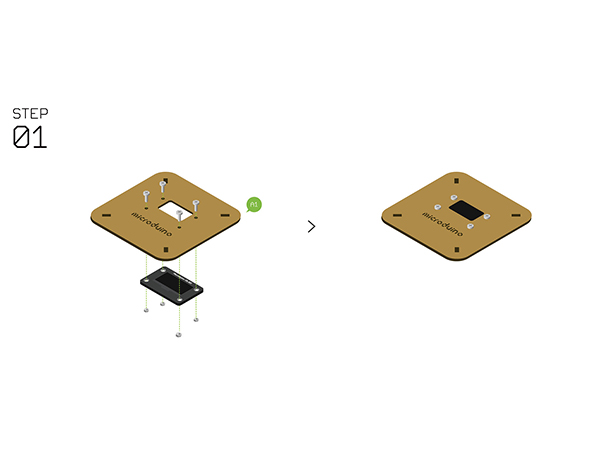
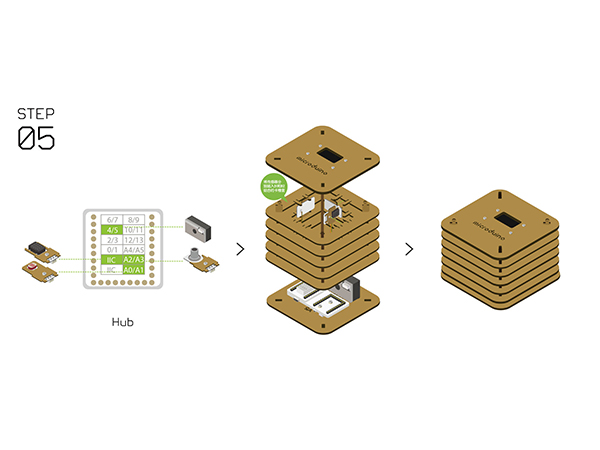
Stick the PM2.5 sensor to the base board.
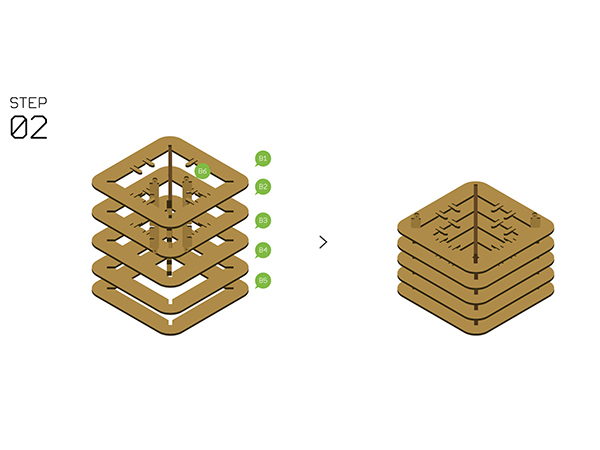
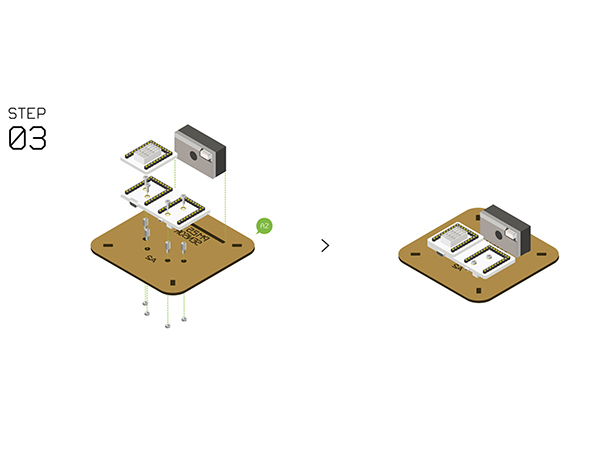
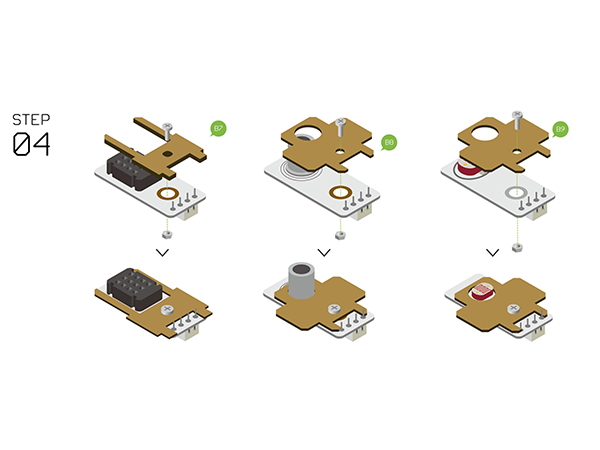
Fixate the sensors on the slot where B1 and B2 combines as it mentioned in Step2, and after that, then connect A1 and A2 on the top and bottom of the system.
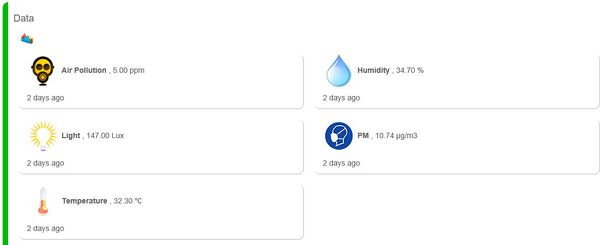
At this time, you can see data of all sensors on the OLED screen. And the same time, you can also see the uploaded weather data on the pre-set mCotton device. Program DescriptionAvailable in China:
//1.About Screen Display =============================
#include"Arduino.h"
#include "U8glib.h"
//2.About Sensor ================================
#include <Wire.h>
#include "I2Cdev.h"
#include <AM2321.h>
#include <SoftwareSerial.h>
//3.About WIFI ================================
#include <Adafruit_CC3000.h>
#include <ccspi.h>
#include <SPI.h>
#include <string.h>
#include "utility/debug.h"
//4.About Sefl-define =============================
#include "def.h"
#include "oled.h"
#include "wifi.h"
#include "sensor.h"

#define INTERVAL_LCD             200        //Refresh interval for OLED and sensors
#define INTERVAL_NET             30000      //Sensor data upload interval

unsigned long lcd_time = millis();          //OLED and sensor update timer
unsigned long net_time = millis();          //Sensor data upload update timer

void setup(void)
{
    Serial.begin(115200);     //Initializing baud rate
    setup_wifi();             //Initializing Wifi
}

void loop(void)
{

    if (lcd_time > millis()) lcd_time = millis();
    if (millis() - lcd_time > INTERVAL_LCD)
    {
        SensorUpdate();         //Sensor update
        volcd(sensorTemp, sensorHumi, sensorLight, sensorPM25, sensorEtoh);   //OLED display update
        lcd_time = millis();    //Timer update
    }

    if (net_time > millis()) net_time = millis();
    if (millis() - net_time > INTERVAL_NET)
    {
        updateWeatherData(sensorTemp, sensorHumi, sensorLight, sensorPM25, sensorEtoh);   //Upload sensor data
        net_time = millis();    //Timer update
    }
}
def.h #define WLAN_SSID "AZURE" //WIFI network name
#define WLAN_PASS "azure001" //WIFI password
#define WEBSITE "mcotton.microduino.cn" //Server address
#define WEBSITEPORT 8080 //Server port number
#define APP_KIT "TLcrn6vaAahjnvKR2" //Device ID #define APP_KIT "YourDeviceID" //Device ID
#define WEBPAGE "/api/v1.0/d"
#define WEBUTTONPAGE "/api/v1.0/ce"
U8GLIB_SSD1306_128X64 u8g(U8G_I2C_OPT_NONE);     //Set OLED type
//-------Font setting: large, medium, small.
#define setFont_L u8g.setFont(u8g_font_7x13)
#define setFont_M u8g.setFont(u8g_font_fixed_v0r)
#define setFont_S u8g.setFont(u8g_font_chikitar)

// Thermometer pattern
const unsigned char bmp_tem[] U8G_PROGMEM =
{
  0xE0,0x81,0x30,0x83,0x10,0x82,0x10,0x82,0x10,0xFA,0x10,0x82,
  0x10,0x82,0x10,0xFA,0x10,0x82,0xD0,0x82,0xD0,0xFA,0xD0,0x82,
  0xD0,0x82,0xD0,0xFA,0xD0,0x82,0xD0,0x82,0xD0,0xFA,0xD0,0x82,
  0xD0,0x82,0xD8,0x86,0xC4,0x88,0xF2,0x93,0xFB,0xB7,0xF9,0xA7,
  0xFD,0xAF,0xFD,0xAF,0xF9,0xA7,0xFA,0x97,0xF2,0x93,0xC4,0x88,
  0x18,0x86,0xF0,0x83
};

//Water drop pattern
const unsigned char bmp_hum[] U8G_PROGMEM =
{
  0x00,0x00,0x01,0x00,0x00,0x01,0x00,0x80,0x03,0x08,0x80,0x03,0x18,0x80,0x07,0x1C,
  0xC0,0x07,0x3C,0xC0,0x07,0x3E,0xE0,0x0F,0x3E,0xE0,0x0F,0x7A,0xF0,0x1F,0x7B,0xF8,
  0x1F,0x72,0xF8,0x1F,0x3E,0xF8,0x3F,0x1C,0xFC,0x3F,0x00,0xFC,0x7F,0x00,0xFE,0x7F,
  0x00,0xFE,0x7F,0x00,0xFE,0x7F,0x00,0xFF,0xFF,0x00,0xFF,0xFF,0x00,0xFF,0xFF,0x00,
  0xF3,0xFF,0x00,0xF2,0x7F,0x00,0xE6,0x7F,0x00,0xC6,0x7F,0x00,0x0E,0x3F,0x00,0x3C,
  0x1E,0x00,0xF8,0x1F,0x00,0xE0,0x07,0x00,0x80,0x01
};

//Display function
void osd_setup(int _osd_setup,char* _osd_text) {
  u8g.firstPage();
  do {
    setFont_L;
    u8g.setPrintPos(4, 30);
    u8g.print(_osd_text);
    u8g.drawFrame(0,48,128,14);
    if(_osd_setup)
      u8g.drawBox(0+2,48+2,map(_osd_setup,0,5,0,128-4),14-4);
  }
  while( u8g.nextPage() );
}


//Display function
void volcd(float temp, float humi, float light, float pm25, float etoh) {
  u8g.firstPage();
  do {
    u8g.setDefaultForegroundColor();

    u8g.drawXBMP( 4, 1, 15, 32, bmp_tem);
    u8g.drawXBMP( 70, 2, 24, 30, bmp_hum);

    setFont_M;                             //Set the font to be large
    u8g.setPrintPos(20, 16);         //Set start coordinate of the text
    u8g.print("`C ");
    setFont_L;                             //Set the font to be large
    u8g.setPrintPos(20, 32);         // Set start coordinate of the text
    u8g.print(temp , 1);             //Temperature

    setFont_M;                             // Set the font to be large
    u8g.setPrintPos(100, 16);         //Set start coordinate of the text
    u8g.print("%");
    setFont_L;                             //Set the font to be large
    u8g.setPrintPos(100, 32);         //Set start coordinate of the text
    u8g.print(humi , 0);             // Temperature

    setFont_L;                       // Set the font
    u8g.setPrintPos(4, 49);          //Set start coordinate of the text
    u8g.print(light , 0);       //Light intensity
    setFont_M;                       // Set the font
    u8g.print(" Lux");

    setFont_L;                       // Set the font
    u8g.setPrintPos(4, 63);          // Set start coordinate of the text
    u8g.print(pm25 , 1);       // Light intensity
    setFont_M;                       // Set the font
    u8g.print(" ug/m3");


    setFont_L;                       // Set the font
    u8g.setPrintPos(80, 49);          // Set start coordinate of the text
    u8g.print(etoh , 0);       //Light intensity
    setFont_M;                       // Set the font
    u8g.print(" ppm");


    setFont_M;                             //Set the font to be large
    u8g.setPrintPos(80, 63);         // Set start coordinate of the text
    u8g.print(" LED:");

  }
  while( u8g.nextPage() );
}


void volcdsetup(char* zi,unsigned int x,unsigned int y) {
  //#ifdef OLED
  u8g.firstPage();
  do {
    setFont_L;
    u8g.setPrintPos(x, y);
    u8g.print(zi);
  }
  while( u8g.nextPage() );
  //#endif
}
   #include <SoftwareSerial.h>
#include <AM2321.h>

AM2321 am2321;
SoftwareSerial pmSerial(4,5);		// Communication soft serial port of the PM2.5 sensor

float sensorTemp;       //Temperature value
float sensorHumi;       //Humidity vale
float sensorPM25;       //PM2.5 density
float sensorLight;      //Light intensity
float sensorEtoh;       //Air quality

//Read PM 2.5 sensor
float PM25(){
  int data_s = 0;		 //Receive data from the serial port
  int num = -1;		   //Receive data counting from the serial port
  int sum = 0;		   //Check sum
  int cal[5];		     //Receive data cache
  float dustDensity = 0;	//PM2.5 density

  pmSerial.begin(2400);		//Start the soft serial port at the beginning
  pmSerial.flush();			  //Clear the serial cache

  while(1)
  {
    if(pmSerial.available() > 0)	//Serial cache data
    {
      data_s = pmSerial.read();		//Read the serial cache data
      if(data_s == 0xAA)			    //Get the start bit of the data frame
      {
        num = 0;      			      //Start counting
      }
      else if(num >= 0)
      {
        num++;				        //Read data. Number+1
        cal[num-1] = data_s;	//Data saved in the cache
        if(num == 6)		      //Read the last bit of the data frame
        {
          sum = cal[0] + cal[1] + cal[2] + cal[3];	//Calculate check sum
          if(sum == cal[4] && cal[5] == 0xFF)		   //Match the check sum and the last bit of the data frame is oxFF, meaning the received data frame is normal.
          {
            dustDensity = (cal[0]*256 + cal[1])*(5.0/1024)*550;		//Calculate PM2.5 density and the unit is ug/m3.
          }
          else			//The received data is not normal.
          {
            dustDensity = 0;    //Density clear
          }
          break;
        }
      }
    }
  }
  pmSerial.end();			//Close the soft serial port
  return dustDensity;	//The returned value
}

//Sensor data update
void SensorUpdate() {

  //Get the density of the PM 2.5
  sensorPM25 = PM25();
  //Get temperature and humidity
  am2321.read();
  sensorTemp = am2321.temperature / 10.0;
  sensorHumi = am2321.humidity / 10.0;
  //Get light intensity
  sensorLight = map(analogRead(A0), 0, 1023, 0, 255);
  //Get air quality
  sensorEtoh= map(analogRead(A2), 0, 1023, 0, 30);

}
Video |
