Temperature and humidity data collection
| Language: | English • 中文 |
|---|
ObjectiveThis tutorial will display the temperature and humidity data data in Processing with a curve which measured by the AM2321 sensor. Equipment
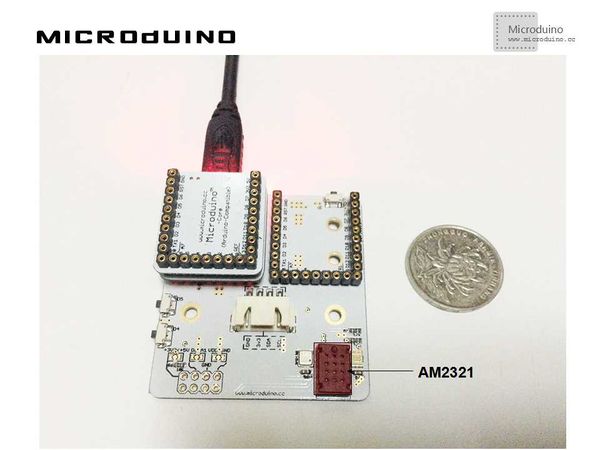
SchematicWe will use the Microduino-Weatherstation's AM2321 sensor directly. ProgramRefers to TemperatureHumidityData TemperatureHumidityDataArduino DebugStep 1:Set up hardware system, as follows: Step 2: Explain the code: This example needs two parts code, one is Processing and the other is Microduino. Microduino: //Get the temperature and humidity data for Processing's display. void loop()
{
am2321.read();
temperature=(float)am2321.temperature/10.0;
humidity=(float)am2321.humidity/10.0;
Serial.print(temperature);
Serial.print(",");
Serial.println(humidity);
delay(100);
}
Processing: //Get the serial port data, // is always my Arduino, so I open Serial.list()[0]. // Open whatever port is the one you're using. myPort = new Serial(this, Serial.list()[0], 9600);
myPort.bufferUntil('\n'); // Trigger a SerialEvent on new line
//Use the different color's curve to display the data that Microduino sent and mark the table scale void draw() {
background(255);
// Draw lines connecting all points
for (int i = 0; i < vals.length-1; i++) {
strokeWeight(1);
stroke(255,0,0);
line(i, vals[i], i+1, vals[i+1]);
stroke(0,0,255);
line(i, vals2[i], i+1, vals2[i+1]);
}
// Slide everything down in the array
for (int i = 0; i < vals.length-1; i++) {
vals[i] = vals[i+1];
vals2[i] = vals2[i+1];
}
String val = myPort.readStringUntil('\n');
if (val != null) {
val = trim(val);
println(val);
String tempAndHumidty[]=val.split(",");
temp=tempAndHumidty[0];
humidity=tempAndHumidty[1];
lux=Float.parseFloat(val);
}
vals[vals.length-1] = 200-temp;
vals2[vals.length-1] = 200-humidity;
//Display scale
fill(0, 0, 0);
text ( "200-", 370, 10);
text ( "--", 370, 50);
text ( "100-", 370, 100);
text ( "--", 370, 150);
text ( "0-", 370, 200);
//show current num
fill(255, 0, 0);
text ( "temp:"+temp+"'C", 0, 15);
fill(0, 0, 255);
text ( "humidity:"+humidity+"%", 0, 28);
}
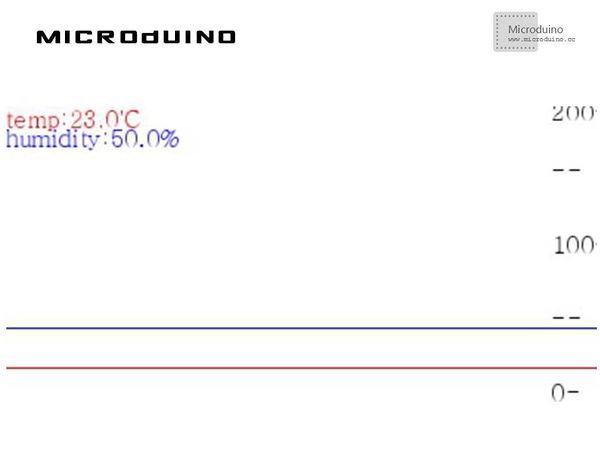
Step 3: Compile the code and download it. Step 4:After running, change the temperature around the sensor, obserbe the curve. ResultScreen will display the temperature and humidity data curve, the temperature curve is red,and the humidity curve is bule. As follows: Video |

