Light intensity data collection
| Language: | English • 中文 |
|---|
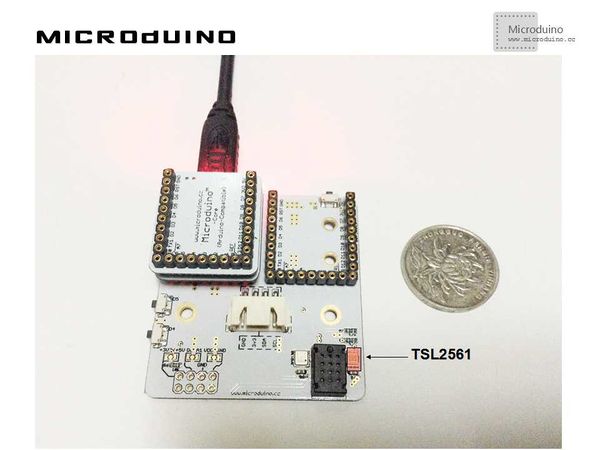
Contents[hide]ObjectiveThis tutorial will display the light intensity data in Processing with a curve which measured by the TSL2561 sensor. Equipment
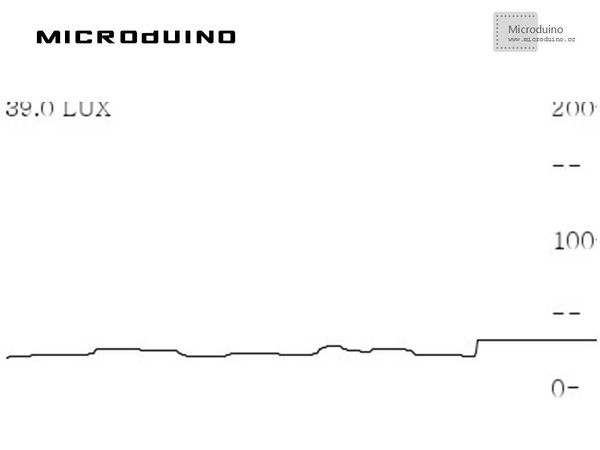
SchematicUse Microduino-Weatherstation's TSL2561 sensor schematic. ProgramRefers to LightDataCollection LightDataCollectionArduino DebugStep 1: Set up hardware system, as follows: Step 2: Explain the code: This example needs two parts code, one is Processing and the other is Microduino. Microduino: //Get the light intensity data and output to serial for Processing's display. void loop()
{
sensors_event_t event;
tsl.getEvent(&event);
/* Display the results (light is measured in lux) */
if (event.light) {
sensor_lux=event.light;
Serial.println(sensor_lux);
}
delay(100);
}
Processing: //Get the the first serial data, // is always my Arduino, so I open Serial.list()[0]. // Open whatever port is the one you're using. myPort = new Serial(this, Serial.list()[0], 9600);
myPort.bufferUntil('\n'); // Trigger a SerialEvent on new line
//Use the curve to display the data that Microduino sent and mark the table scale void draw() {
background(255);
// Draw lines connecting all points
for (int i = 0; i < vals.length-1; i++) {
stroke(0);
strokeWeight(1);
line(i, vals[i], i+1, vals[i+1]);
}
// Slide everything down in the array
for (int i = 0; i < vals.length-1; i++) {
vals[i] = vals[i+1];
}
String val = myPort.readStringUntil('\n');
if (val != null) {
val = trim(val);
println(val);
lux=Float.parseFloat(val);
}
vals[vals.length-1] = 200-lux;
//Display scale
text ( "200-", 370, 10);
text ( "--", 370, 50);
text ( "100-", 370, 100);
text ( "--", 370, 150);
text ( "0-", 370, 200);
//show current num
text ( lux+"LUX", 0, 10);
}
Step 3: Compile the code and download it. Step 4: After running the program, find a light source sloshing around the sensor, and see if the screen can show the light intensity data. ResultScreen will display the light intensity curve, as follows: Video |

