Difference between revisions of "Open Source WiFi Weather Station System"
From Microduino Wiki
(→Get and Configure Blynk) |
|||
| Line 91: | Line 91: | ||
*You can scan the two-dimension code below to get Weather Station APP. | *You can scan the two-dimension code below to get Weather Station APP. | ||
|width="50%" valign="top" align="left"| | |width="50%" valign="top" align="left"| | ||
| − | [[File: | + | [[File:BlynkWeatherStationLink.png||300px|center]] |
|} | |} | ||
| Line 101: | Line 101: | ||
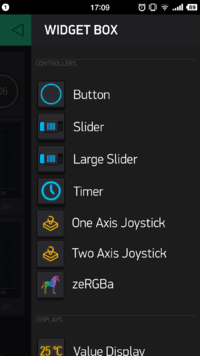
*In this case, you can click the panel and call out '''WIDGET BOX''', on which you can see many choices. | *In this case, you can click the panel and call out '''WIDGET BOX''', on which you can see many choices. | ||
|width="50%" valign="top" align="left"| | |width="50%" valign="top" align="left"| | ||
| − | [[File: | + | [[File:BlynkSetting3.png||200px|center]] |
|} | |} | ||
| Line 112: | Line 112: | ||
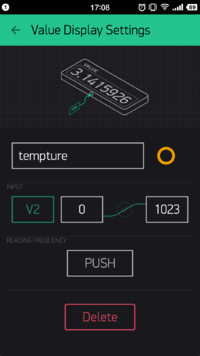
*Select V2 on '''INPUT'''; Choose PUSH on '''READING FREQUENCY''', which indicates the temperature is sent from the Weather Station and the frequency is controlled by Microduino Client. | *Select V2 on '''INPUT'''; Choose PUSH on '''READING FREQUENCY''', which indicates the temperature is sent from the Weather Station and the frequency is controlled by Microduino Client. | ||
|width="50%" valign="top" align="left"| | |width="50%" valign="top" align="left"| | ||
| − | [[File: | + | [[File:BlynkSetting4.png||200px|center]] |
|} | |} | ||
| Line 142: | Line 142: | ||
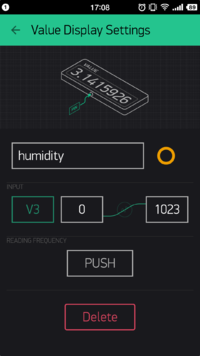
* The setting of the humidity is similar with that of temperature; Set '''INPUT''' as V3 and send it through a timer function " senTempHumi()". | * The setting of the humidity is similar with that of temperature; Set '''INPUT''' as V3 and send it through a timer function " senTempHumi()". | ||
|width="50%" valign="top" align="left"| | |width="50%" valign="top" align="left"| | ||
| − | [[File: | + | [[File:BlynkSetting5.png||200px|center]] |
|} | |} | ||
| Line 167: | Line 167: | ||
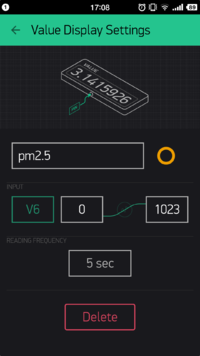
* Set PM2.5's '''INPUT''' as V6, '''READING FREQUENCY''' as 5s, which represents frequency of the acquired PM2.5 data. | * Set PM2.5's '''INPUT''' as V6, '''READING FREQUENCY''' as 5s, which represents frequency of the acquired PM2.5 data. | ||
|width="50%" valign="top" align="left"| | |width="50%" valign="top" align="left"| | ||
| − | [[File: | + | [[File:BlynkSetting6.png||200px|center]] |
|} | |} | ||
| Line 192: | Line 192: | ||
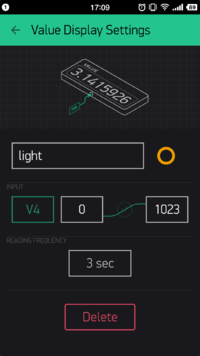
* Similarly, set the '''INPUT''' of the Light Sensor as V4 and the frequency is to get value every 3s. | * Similarly, set the '''INPUT''' of the Light Sensor as V4 and the frequency is to get value every 3s. | ||
|width="50%" valign="top" align="left"| | |width="50%" valign="top" align="left"| | ||
| − | [[File: | + | [[File:BlynkSetting7.png||200px|center]] |
|} | |} | ||
| Line 219: | Line 219: | ||
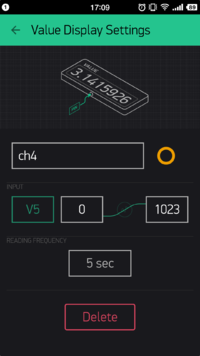
* The '''INPUT''' of the methane gas is V5 and the frequency is to get value every 5s. | * The '''INPUT''' of the methane gas is V5 and the frequency is to get value every 5s. | ||
|width="50%" valign="top" align="left"| | |width="50%" valign="top" align="left"| | ||
| − | [[File: | + | [[File:BlynkSetting8.png||200px|center]] |
|} | |} | ||
| Line 246: | Line 246: | ||
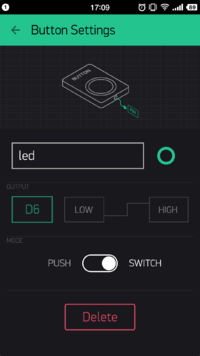
* Set '''OUTPUT''' as V6 and '''MODE''' as SWITCH, meaning each time you press the button, you can switch electric level of the D6 pin at the Microduino Client. | * Set '''OUTPUT''' as V6 and '''MODE''' as SWITCH, meaning each time you press the button, you can switch electric level of the D6 pin at the Microduino Client. | ||
|width="50%" valign="top" align="left"| | |width="50%" valign="top" align="left"| | ||
| − | [[File: | + | [[File:BlynkSetting9.png||200px|center]] |
|} | |} | ||
| Line 257: | Line 257: | ||
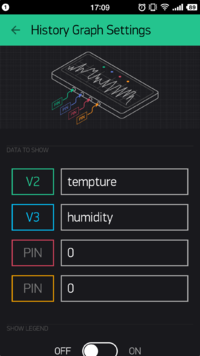
*Can be set as data graph displaying V2 and V3. (can achieve four data display at most.) | *Can be set as data graph displaying V2 and V3. (can achieve four data display at most.) | ||
|width="50%" valign="top" align="left"| | |width="50%" valign="top" align="left"| | ||
| − | [[File: | + | [[File:BlynkSetting10.png||200px|center]] |
|} | |} | ||
| Line 267: | Line 267: | ||
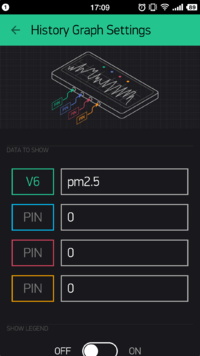
*The second '''History Graph''' can be used for displaying V6, PM2.5. | *The second '''History Graph''' can be used for displaying V6, PM2.5. | ||
|width="50%" valign="top" align="left"| | |width="50%" valign="top" align="left"| | ||
| − | [[File: | + | [[File:BlynkSetting11.png||200px|center]] |
|} | |} | ||
| Line 277: | Line 277: | ||
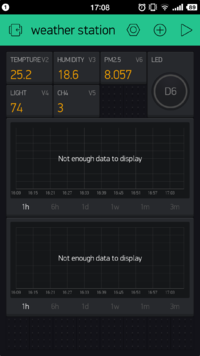
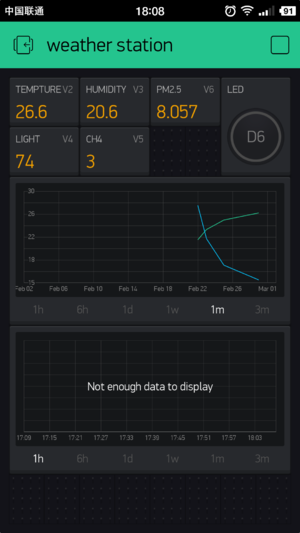
*Finally, your phone panel turns into this: | *Finally, your phone panel turns into this: | ||
|width="50%" valign="top" align="left"| | |width="50%" valign="top" align="left"| | ||
| − | [[File: | + | [[File:BlynkSetting12.png||200px|center]] |
|} | |} | ||
Revision as of 01:18, 29 March 2016
Contents[hide]Outline
Instroduction:
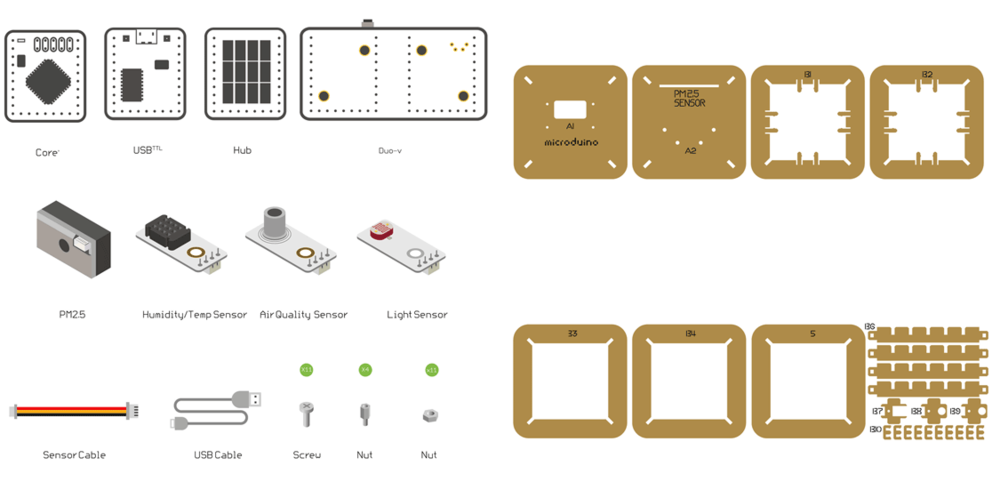
Bill of MaterialMicroduino Equipment
Other Equipment
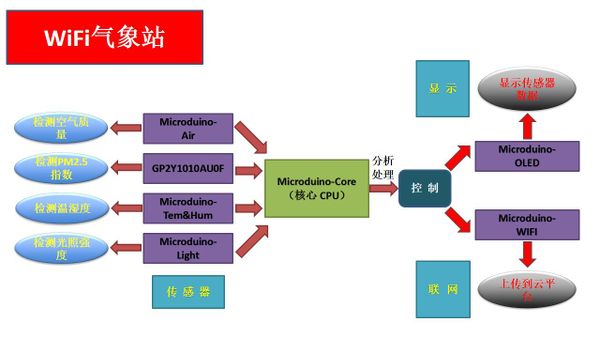
Principle of the ExperimentThis Weather Station can detect data including:
Get and Configure BlynkNext, we'll learn how Microduino interacts with Blynk through the configuration process of the Weather Station. Get Blynk Phone Client
Add Configuration Items
Program DownloadWeather Station Code: ESP8266BlynkWeatherStation Programming
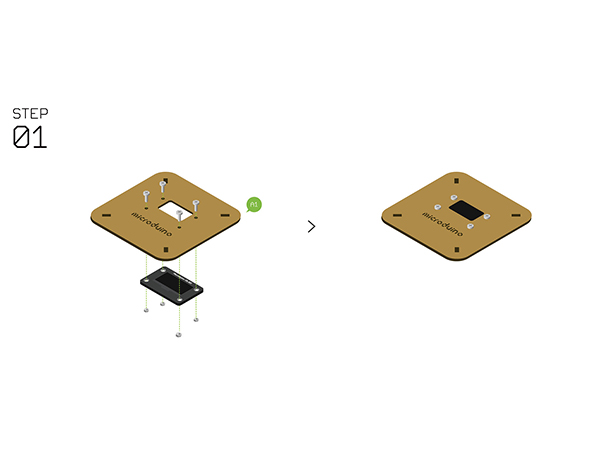
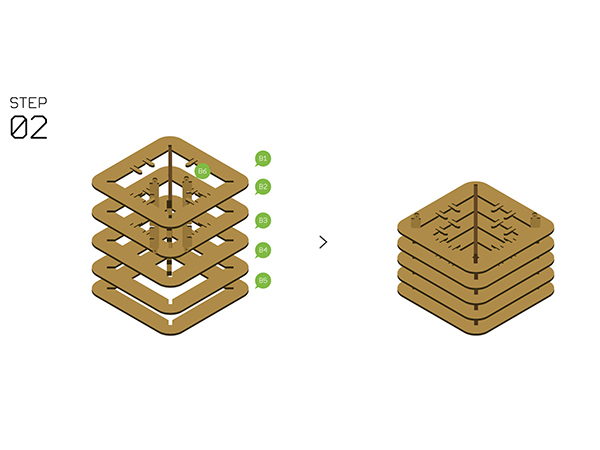
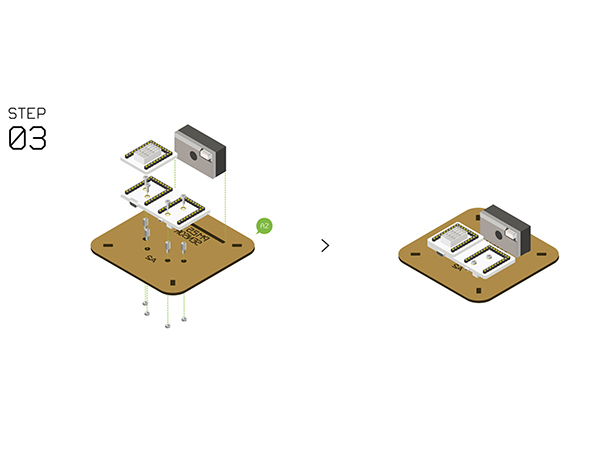
Hardware Buildup
Notes
|
